

Next: 7.2 GAIA BBP Flux
Up: 7. A Case Study:
Previous: 7. A Case Study:
Contents
7.1 HST WFPC2 Image
The HST WFPC2 image on which the simulations presented in this Chapter are
based is a Planetary Camera (PC, see Section 6.1) image of the
central regions of the M100 spiral galaxy, obtained with a 900 s exposure
with the F555W filter.
This image was chosen because it contains most interesting features one would
like to observe in bright galaxies: a conspicuous core, large surface
brightness variations on short space scales, spiral arms and HII
regions7.1.
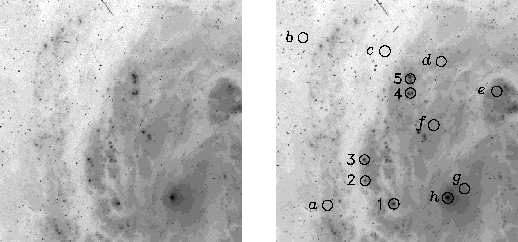
The central part of this image, namely a square of about 16 arcsec
side whose flux map was reconstructed from the simulated observations, is
shown in Figure 7.1.
Figure 7.1:
HST WFPC2 PC image of M100. Central part of a WFPC2 PC image of the spiral
galaxy M100, obtained with a 900 s exposure with the F555W filter, similar to
 .
Encircled on the right image is the position of the eight zones used to
calculate the median surface brightness in Table 7.1 (letters
 -
- ) and of the five HII regions of which aperture photometry is carried
out in Section 7.7 (numbers 1-5).
The image side is about 16 arcsec and the circles have a diameter
of about 0.7 arcsec.
 |
The median surface brightness in  inside the eight circles marked by
letters is given in Table 7.1.
These values were calculated following the WFPC2 photometric calibration
obtained by [Holtzman et al. 1995b], and indicate the surface brightness range
spanned by the image.
Note that the median surface brightness of the whole image is
 mag/arcsec
 .
.
M100 is classified as Sc(s)I in [Sandage and Bedke 1994] and the [de Vaucouleurs et al. 1991] report a
photoelectric total magnitude  and an effective radius of about 104
arcsec, meaning that the sky region shown in Figure 7.1
covers its very central parts only.


Next: 7.2 GAIA BBP Flux
Up: 7. A Case Study:
Previous: 7. A Case Study:
Contents
Mattia Vaccari
2000-12-05


![]() inside the eight circles marked by
letters is given in Table 7.1.
These values were calculated following the WFPC2 photometric calibration
obtained by [Holtzman et al. 1995b], and indicate the surface brightness range
spanned by the image.
Note that the median surface brightness of the whole image is
inside the eight circles marked by
letters is given in Table 7.1.
These values were calculated following the WFPC2 photometric calibration
obtained by [Holtzman et al. 1995b], and indicate the surface brightness range
spanned by the image.
Note that the median surface brightness of the whole image is
![]() mag/arcsec
mag/arcsec![]() .
.
![]() and an effective radius of about 104
arcsec, meaning that the sky region shown in Figure 7.1
covers its very central parts only.
and an effective radius of about 104
arcsec, meaning that the sky region shown in Figure 7.1
covers its very central parts only.